
Continuous improvement

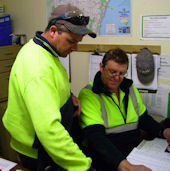
The supervisor (on the right) of this harvesting operation is discussing log quality issues with the owner of the local sawmill. They are looking at the recovery rates of sawn timber from logs coming from the coupe. By meeting and discussing each other's perspective on this issue, they are able to work together to make improvements that will benefit them both.
The 'continuous improvement' process is a cycle. Activities are monitored and the plans are reviewed and improved constantly. Sometimes the changes are tiny. Other times there needs to be a substantial shift in the ways things are done.
Set out below are the main elements of the continuous improvement process.
Analyse the current situation

Before you can propose any improvements to a plan or process, you need to have a good understanding of how it currently works and where the problem areas are.
More information on analysing the situation.

Consult with others
It's important to consult widely, particularly with those who will be most affected by any proposed changes. This helps to ensure that you don't miss any important elements that need to be considered.
More information on the consultation process

Set objectives
Every successful improvement plan begins with a clear set of objectives. These are your end goals and they give you an overall direction to aim in.
More information on setting objectives

Develop a solution
Once you've defined your objectives you need to find a solution that will allow you to reach them in the most effective way.
More information on developing a solution

Implement the solution
Generate a list of activities to be done, work out the sequence of steps required, define the responsibilities of all personnel, and then put the plan into action.
More information on implementing the solution
Reviewing the results
This is the 'proof of the pudding', where you monitor the changes you've introduced and compare the results with your original goals. We'll look at this process in more detail in the next section: Developing new approaches.
Learning Activity
In the link provided above for more information on analysing the situation, we have shown an example of a Pareto chart. This example provides a graphic representation of the chainsaw repairs carried out in workshop, broken down into types of repairs and ranked according to frequency.
You'll see that the chainsaw parts that required repair or replacement have roughly followed the '80-20 rule', where about 80% of the issues came from 20% of the parts.
Have a think about some of the issues you deal with that can be categorised according to frequency of occurrence, cost, output, downtime hours, or some other quantifiable unit of measure. Choose one that you think might fit the pattern of the 'Pareto principle' and test your theory by making up a Pareto chart. How close a fit is the data to the 80-20 rule?
Share your answers with your trainer and other learners in your group. You may wish to use group emails or a social networking site.